

The EU has been one of the front-runners on climate policy ever since the Kyoto Protocol was adopted in 1997. However, according to geologist and energy author Euan Mearns, who runs the blog Energy Matters and is a former editor of the famous “peak oil” website The Oil Drum, Kyoto has been an outright failure and current EU energy policy is futile and counterproductive. He wonders why EU governments “continue to pursue this futile course of action”.
The Kyoto Protocol, designed to limit CO2 emissions from industrialised nations was adopted in 1997. The first commitment period began in 2008 and ended in 2012. These landmark dates are marked by arrows on Figure 1. In this period, the rate of global CO2 emissions accelerated (Figure 1). It is difficult to regard the Kyoto process as anything but a total failure.
In the same period, since 1997, Global average temperatures have risen by <0.1˚C (based on Hadcrut4 data) despite cumulative emissions of 460 Gt CO2 being added to the atmosphere (Figure 2). In the period 1997 to 2012 there is absolutely no evidence from the atmospheric temperature record that global warming or climate change are linked to CO2 emissions*. (But see my cautionary note at the end of this piece.)
European Union (EU) and UK energy policies aimed at reducing CO2 emissions have failed to make any impact at the Global level. These same policies have succeeded in pushing up electricity prices, making EU economies less competitive and in spreading energy poverty amongst the poorer people of Europe.
Based only on data from the cherry picked time interval 1997 to 2012 one would conclude that EU energy policy has failed to address a non-existent problem.
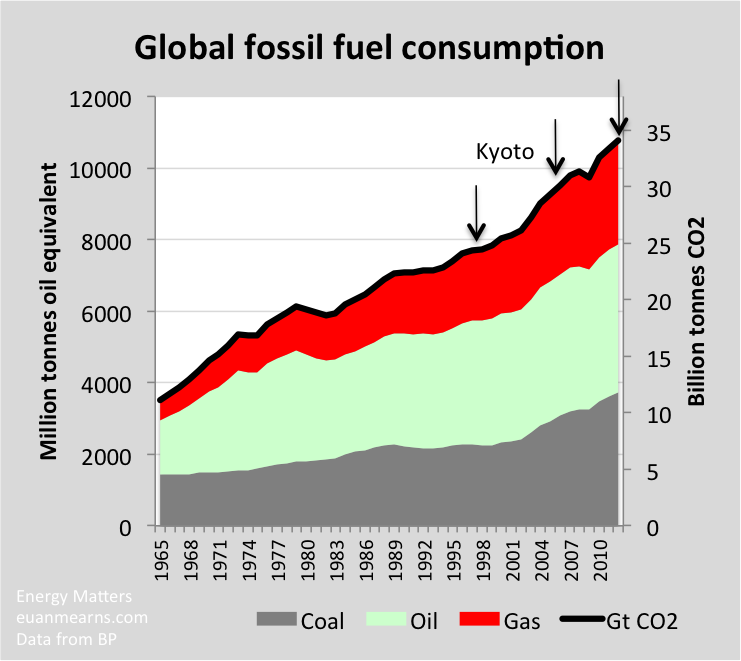
Figure 1 Global fossil fuel consumption expressed in millions of tonnes of oil equivalent (mmtoe) from the 2013 BP statistical review of world energy. Mmtoe converted to CO2 by assuming CH2 as general formula for oil with molecular weight=14 atomic mass units (amu) and a molecular weight for CO2=44 amu. The arrows show landmark dates in the Kyoto process. During this period, CO2 emissions accelerated. The only process to halt the relentless rise in CO2 emissions is spikes in the oil price causing recessions in 1974, 1979 and again in 2008.
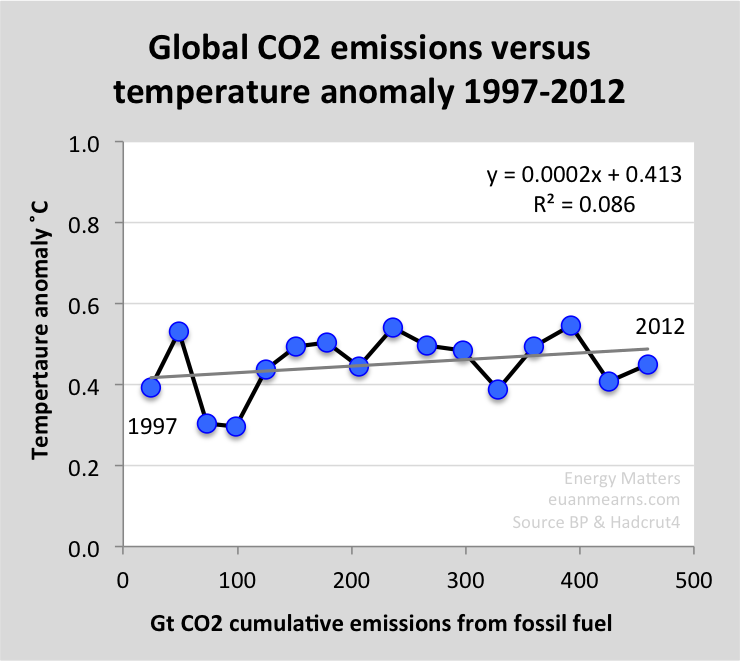
Figure 2 Annual averages for global lower troposphere temperatures from Hadcrut4 as reported by Woodfortrees. Hadcrut4 is compiled by a joint venture between the UK Met Office and the Climate Research Unit at the University of East Anglia and is one of several such compilations of surface temperatures based on historical thermometer records. Since 1997, cumulative global CO2 emissions from combusting fossil fuels amount to 460 Gt. The gradient of the line y=0.000 and the correlation coefficient R2=0.09 means that there is no correlation between emissions and surface temperatures over this 15 year period.
The Failure of Kyoto
It is straightforward to understand why the Kyoto first commitment period failed. Figure 3 shows the few countries that were fully committed to this process. Canada, a large producer and consumer of oil and gas withdrew in 2012. Without full and active participation of the USA, Canada, Australia, Russia, China, India, S Korea, the whole of the Middle East and OPEC, Kyoto was bound to fail. The issue that is very difficult to understand is why a handful of EU countries have persevered with this charade.
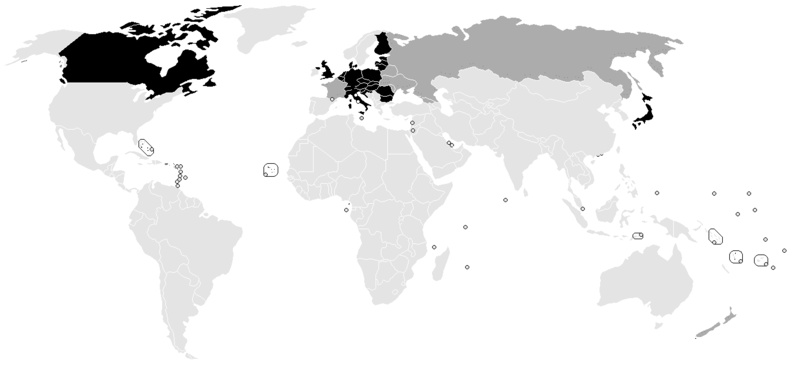
Figure 3 A map from Wikipedia that shows countries (in black) that fully signed up for Kyoto. Canada has since unsigned and Japan, post Fukushima, has decided that having the lights on, powered by natural gas, is preferable to futile attempts to reduce CO2 emissions. The handful of EU countries left in the middle are deluded if they believe their unilateral actions are going to make any difference at all to global CO2 emissions.
Wikipedia has this to say about the second commitment period:
The 37 parties with binding targets in the second commitment period are Australia, the European Union (and its 28 member states), Belarus, Iceland, Kazakhstan, Liechtenstein, Norway, Switzerland, and Ukraine. Belarus, Kazakhstan and Ukraine have stated that they may withdraw from the Protocol or not put into legal force the Amendment with second round targets. Japan, New Zealand, and Russia have participated in Kyoto’s first-round but have not taken on new targets in the second commitment period. Other developed countries without second-round targets are Canada (which withdrew from the Kyoto Protocol in 2012) and the United States (which has not ratified the Protocol).
Like the first commitment period, the second is bound to fail to make any mark at all on global emissions. Why are EU governments continuing to pursue this futile course of action?
The Impact on Climate Change
With the unequivocal failure of Kyoto to abate global CO2 emissions one would think that planet Earth would be well on its way to melt down. In fact, the opposite has occurred. Since Kyoto was adopted in 1997 there has been effectively zero change in globally averaged surface temperatures (Figure 2). Had temperatures continued to rise on the pre-1997 trajectory I too would be adding my voice to those calling for action. But they haven’t! Temperatures have moved sideways for 15 years (maybe they should have been drifting down?). The climate science community should be expressing vast relief at the fact that their dire predictions have not yet come to pass. But instead the arguments and data presentations of the IPCC are becoming increasingly contorted. Has anyone ever heard a Warmist rejoice at the fact that they might just be wrong?
Part of the contortion of data is the expansion of the definition of warming to include not just the atmosphere but the cryosphere and the hydrosphere as well. What about the sea ice? The Global sea ice anomaly is currently positive, and has been for much of this year! (Figure 4).
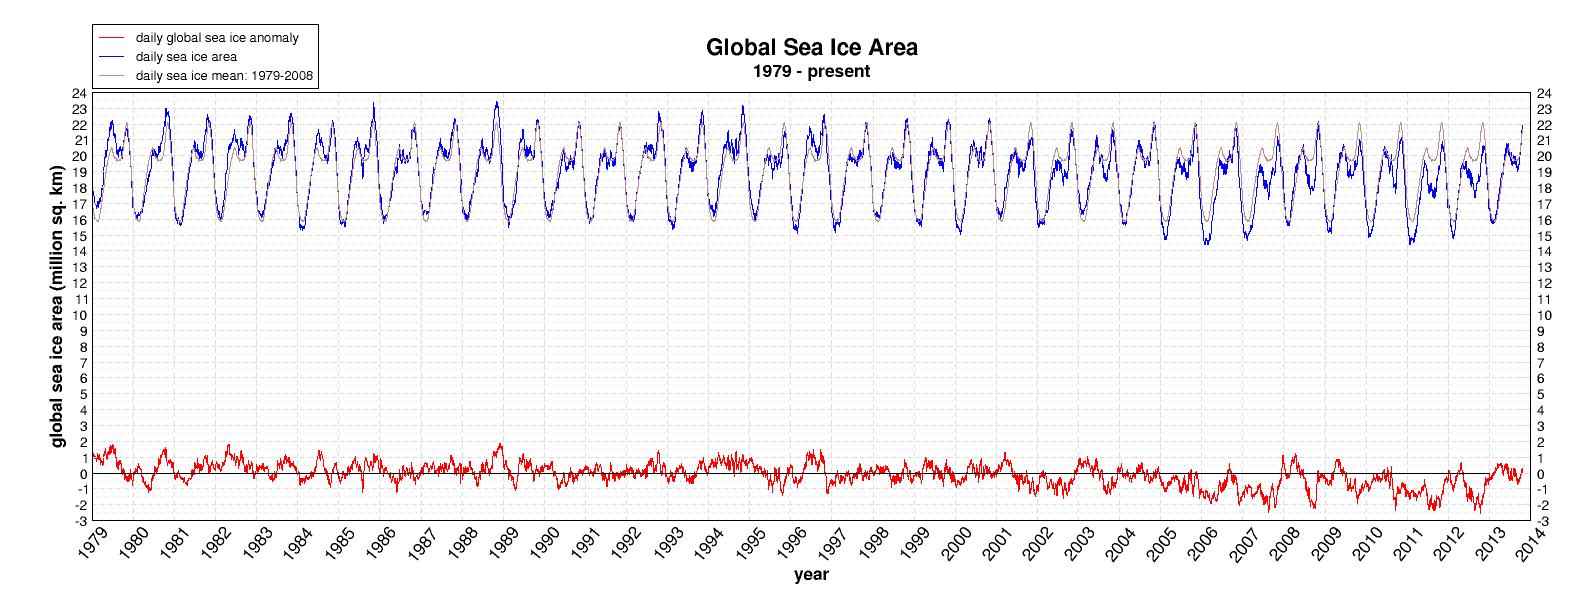
Figure 4 Global sea ice anomaly (in red) from The Cryosphere Today (University of Illinois). Despite all the hype about melting sea ice etc the FACT is that the global sea ice area today is marginally higher (positive anomaly) than the 1979 to 2008 mean value. It has been positive for the greater part of 2013
What about the disappearing Arctic sea ice? A letter published in Nature by Kinnard et al (ref 1) has this to say about past cyclical change in the Arctic sea ice:
The pronounced decrease in ice [Arctic] cover observed in both our terrestrial and oceanic proxy-based reconstructions between the late fifteenth and early seventeenth centuries occurred during the widespread cooling period known as the Little Ice Age (about AD 1450–1850).
When I first read this I was very sceptical since it is rather counterintuitive, but I believe now this may fit with a number of observations linked to Arctic Sea Ice distribution that I will return to in a later post. Unfortunately, Kinnard et al spoil what may have been a fine paper by splicing proxy with satellite data to produce a scary hockey stick.
European citizens and politicians should be concerned by recent extreme cold winters and a possible correlation with receding Arctic sea ice, both of which are likely linked to natural phenomena that are beyond our control. But we could plan to keep warm.
The Futility of European Energy Policy
The description of European Energy policy as described by Wikipedia makes it easy to understand what is wrong with it. The first section describes accurately what the real problems are:
In 2007, the EU was importing 82% of its oil and 57% of its gas, which then made it the world’s leading importer of these fuels. Only 3% of the uranium used in European nuclear reactors was mined in Europe.
And the second part describes policies designed to combat a completely different issue, i.e. abating CO2 emissions and tackling climate change.
- A cut of at least 20% in Greenhouse gas emissions from all primary energy sources by 2020 (compared to 1990 levels), while pushing for an international agreement to succeed the Kyoto Protocol aimed at achieving a 30% cut by all developed nations by 2020.
- A cut of up to 95% in carbon emissions from primary energy sources by 2050, compared to 1990 levels.
- A minimum target of 10% for the use of biofuels by 2020.
And this sets policy off in a direction that is often directly opposed to addressing the risks of declining primary energy production, energy security draining away and spiralling energy costs. By way of example, carbon capture and storage (CCS) and bio-fuel production consume resources. Carbon pricing and trading schemes are designed to make energy more expensive.
What has European energy policy achieved? Germany perhaps provides the best case study with its ambitious Energiewende (energy transition). German renewables consumption (ex hydro) now makes up 8.3% of total primary energy consumption, but as described in an earlier post, roughly 73% of German renewable electricity has gone to make up the shortfall in nuclear production caused by premature closure of power stations post Fukushima (Figure 5). The remaining 27% may have offset coal and gas combustion, but on the Global scale this is a wholly insignificant number and the coal and gas not burned in Germany will simply have been burned elsewhere. The German people need to be aware that their stupendous effort has and will continue to amount to naught in the futile battle to abate CO2 emissions.
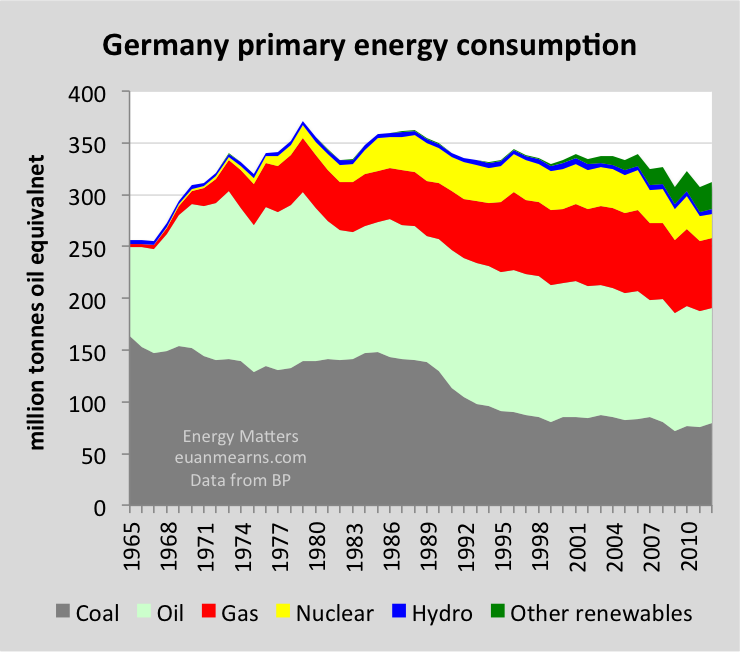
Figure 5 Germany has a diverse primary energy mix of coal, oil, gas, nuclear and renewables. The growth in other renewables (wind, solar, geothermal, biomass and waste) has gone largely to fill the gap left by closure of nuclear power stations and has made effectively zero contribution to the reduction of global CO2 emissions.
The cost of energy
The cost of energy is still very much in the news, in the UK at least. Members of Parliament (MPs) are baying for the blood of those responsible. There are two main causes of high European energy prices today. The first is high international energy prices caused by global demand for energy rising more rapidly than supply. The second is misguided energy policies and subsidies designed to make renewable energy cost competitive with currently much cheaper fossil alternatives. If UK MPs want the cost of energy to fall, then they should abolish The Climate Change Act and replace it with energy legislation that is fit for the purpose of providing secure, reliable and affordable energy for all.
A final cautionary note
While there is no evidence for a link between CO2 emissions and global surface temperatures in the period 1997 to present it does not necessarily follow that atmospheric CO2 has no impact upon natural cyclic changes in Earth’s climate.
References
1) Reconstructed changes in Arctic sea ice over the past 1,450 years: Christophe Kinnard, Christian M. Zdanowicz, David A. Fisher, Elisabeth Isaksson, Anne de Vernal & Lonnie G. Thompson; Nature 479, 2011
 Geologist Euan Mearns is Honorary Research Fellow at The University of Aberdeen and former editor of the famous “peak oil” website The Oil Drum which ran for more than 8 years, but stopped publishing in September 2013. Euan has since started publishing his own (excellent) blog, called Energy Matters. This article was republished from his blog with permission. Here are some examples of his other recent posts, all of them worth reading:
UK North Sea Oil Production Decline
The changing face of UK electricity supply
Energiewende: Germany, UK, France and Spain

On October 31, USA Today reported: “Some parts of the Pacific Ocean have warmed 15 times faster in the last 60 years than they did during the previous 10,000 years.” The oceans are part of the global thermal equation with far greater physical inertia than the atmosphere. Warming effects require longer to become manifest, but they are likewise far more enduring.
The thermal characteristics of greenhouse gases became topical in the 1950’s, when the guidance systems of heat-seeking missiles needed to be adjusted to compensate for CO2. It is therefore a stretch of credibility to hypothesize that the Earth will not be warmed by increasing carbon emissions despite spectral properties similar to those of a greenhouse. Yet even discounting global warming, the necessity of immediately limiting atmospheric CO2 concentrations is evidenced by ocean pH levels declining 100 times more rapidly than any other period in geological history. If this ocean acidification continues in step with fossil fuel usage, marine food chains will begin breaking up interminably within just a few decades, severely reducing protein availability for billions of people.
Isn’t it abundantly clear why the EU has insisted on its self-destructive energy policy? The answer is a very simple one, the EU calculated that its own suppression of oil & primarily gas consumption would hurt Russia even more and allow for either regime-change in Moscow or enough pressure so that the Russians gave up on Syria > Hence the Qatar-EU pipeline could be built.