

![]() Bans on subsidies (in some countries) and reduced costs have hit total investment in onshore wind. Meanwhile, market share continues to grow across the EU28. Wind energy now accounts for almost 20% of installed capacity for power generation which makes researcher Schalk Cloete’s sobering analysis of risks for onshore wind well worth reading. Following up on his previous article, he examines current assumptions and argues that the discount rate and declines in value (combined with cost of integration) take their toll on returns…
Bans on subsidies (in some countries) and reduced costs have hit total investment in onshore wind. Meanwhile, market share continues to grow across the EU28. Wind energy now accounts for almost 20% of installed capacity for power generation which makes researcher Schalk Cloete’s sobering analysis of risks for onshore wind well worth reading. Following up on his previous article, he examines current assumptions and argues that the discount rate and declines in value (combined with cost of integration) take their toll on returns…
Establishing a formula
The conclusions reached are based on an analysis of discounted cash flow for only 1 kW onshore wind over a one year construction period followed by an operating period that lasts for as long as the plant is profitable or up to a maximum of 40 years. The investment is made in the first year, followed by the annual receipt of revenues from electricity sales and payment of operating and maintenance (O&M) costs.
Capital costs are taken to be $2000/kW, a good global average when adjusting for purchasing power parity (see previous article) and O&M costs are taken to be 2.5% of the capital cost per year and these costs remained constant over the plant lifetime. However, according to the most recent US wind technologies market report , turbine performance begins to decline at a linear rate of 2% after the ninth operating year.
After the initial $2000 capital investment, the annual cash flows from electricity sales at an average wholesale price of $60/MWh and a capacity factor of 30% (shown below). The linear decline in plant performance is clearly visible after year 9 – even though, based on BP data , the 30% capacity factor is optimistic compared with the global average that has hovered around 26% for the past 5 years .

Using this information without a discount rate (i.e. applying discount rate of 0%) you will eventually see a return . Apply a discount rate of 2% and the net return on investment is zero. In other words, this analysis would return a levelized cost of electricity of $60/MWh if the discount rate is set to 2%. But a more realistic discount rate would be 8% meaning the initial investment cannot be recovered.
![]()
Now it gets technical
Subsequently, the effects of the value declines and cost increases related to intermittency (“integration costs” discussed in the previous article) have to be factored in.
- The added cost of grid connection – an up-front cost with average distances between the wind farm and the consumer at 100 km, yielding an added capital cost of $200/kW at a transmission cost of $2/kW/km
- Balancing costs are assumed to scale directly with the wind energy market share, adding $0.3/MWh for every percentage point of market share. This is about half the current balancing cost in Germany.
- The value decline of wind power is modelled according to the following market value factor. At market shares higher than 15%, the linear trend is extrapolated.

Wind and solar value factors (a value factor of 1 is for a generator with a constant output) as a function of their respective market shares (source).
Cash flows
The following annual cash flows are generated when these assumptions are applied to a plant constructed when the wind market share is 5% (current global average) and increasing by 1% per year up to a maximum of 40%. The more rapid decline in revenue (caused by the value decline) and the increased balancing costs are clearly visible.

As shown in the cumulative cash flow analysis below, the initial investment can now no longer be recovered, even under a 0% discount rate. In fact, the plant starts to lose money around year 24 as declining revenues fall below increasing costs.
Effect of the discount rate
The effect of discount rate on the average electricity price required is shown below with and without the value declines and cost increases from intermittency. Note that the average electricity price required is used here instead of the levelized cost of electricity to account for the value decline of wind power with increasing market share. This measure can be interpreted as the average market price over an entire year that will yield a zero return on investment with a specified discount rate. The actual electricity price received by the wind farm will be lower.
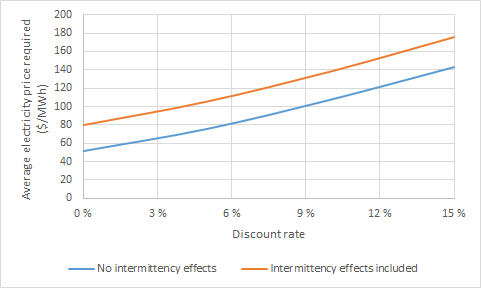
The graph clearly shows a large increase in the required electricity price as the discount rate is increased. Inclusion of the value decline, balancing costs and grid costs increases the required electricity price by about $30/MWh at all discount rates.
Quantifying the risk
Next, the influence of the risk of accountability for value declines and cost increases caused by intermittency will be quantified. This quantification is done by determining the discount rate giving zero return on investment when the average electricity price is set to $60/MWh. The annualized return on investment is then quantified as the discount rate minus 2% to account for margin erosion from technological improvements of new plants that come online during the plant lifetime as well as financial/legislative costs (paying the bankers and lawyers involved in setting up financing for the plant).
As shown below, the investment return is exactly 0% when wind farms carry no accountability for intermittency costs (blue bar). The sensitivity to the three different intermittency effects is shown by the orange bars. When a 100 km grid connection is included, the annualized investment return drops by only 0.7%. Adding the value decline effect causes a much larger 4.6% drop. Further addition of the balancing costs also has a large effect, reducing the total annualized investment return to almost -8%.
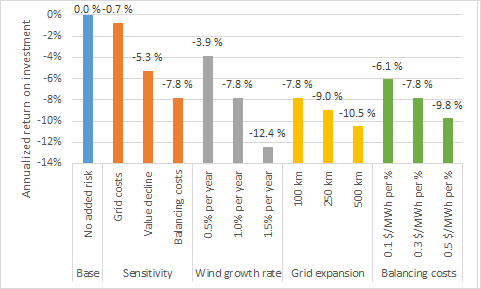
The magnitude of the drop in investment returns is strongly influenced by the rate of wind power expansion over the lifetime of the plant (grey bars). More wind on the grid will reduce the value and increase the balancing costs of all wind generators. Every increase in the wind expansion rate of 0.5% market share per year drops the annualized investment return by about 4%.
The effect of added grid expansion costs (yellow bars) is smaller. Increasing the required grid connection from 100 km to 500 km (thus increasing the added up-front cost from $200/kW to $1000/kW) only decreases the annualized investment return by 2.7%.
Finally, the effect of balancing costs is shown by the green bars. Every increase of $0.2/MWh per % of wind market share decreases the investment return by about 2%.
Conclusions
Anticipating the potential for substantial intermittency costs to eventually be fairly attributed to wind generators presents a major risk for wind farm investors. And even when these intermittency effects are ignored, the global average wind turbine does not give a reasonable return on investment without direct subsidisation. Of course, there are locations where wind is much more attractive (for example, the US great plains achieve an 8.7% return at 45% capacity factor and $1600/kW capital cost), where wind energy remains attractive at relatively low market shares.
When intermittency costs are correctly accounted for, the investment returns fall drastically. The annualised return on investment drops from 0% to -8% when intermittency costs and value declines are taken into account.
The most influential factor in the analysis is the rate of wind power expansion. Higher expansion rates lead to larger investment losses. Interestingly, this dynamic reduces the risk for onshore wind investment because the strong increases in wind market share that cause this risk will not take place if value declines and integration costs are fairly assigned to wind generators.
All of this reinforces the notion that continued wind power expansion will require perpetual subsidies. If wind power is to have the impact envisioned by green advocates, the large investment losses caused by their value declines and integration costs will need to be borne by other sectors of the economy for decades to come.
Editor’s note: This article published over our new contributor’s platform, you can register here

The conclusions of the post don’t fit with the recent German onshore wind bids; €40-€63/MWh during 20yrs and thereafter the then lower market prices.
In NL, govt estimated an whole sale price of ~€29/MWh for 2035 (at the Borssele offshore wind auctions).
– Integration & intermittency costs
Those are not calculated for NPP’s, etc. While those need an expensive spinning reserve because they can fail totally in a second. So why an exception for wind?
The wind owner has to live up his delivery commitments, and gets a huge fine if he doesn’t. Just as other generators.
– Grid connection & balancing costs.
After studies about the right distribution of those costs in NL, it was decided that generators pay until the nearest substation of Tennet (the grid operator), where transformation to high voltages occur. And that Tennet takes all cost of the substation and the redundant high tension lines thereafter.
Tennet also pays the balancing costs (they order those services). The costs of Tennet to be paid by the users.
Why assign those costs to wind and not to all other generators?
Seems to me that the wind generator can complain with success at Luxembourg.
– value decline of wind power
We may assume that bidders took those into account…
I assume that they could bid for such low prices because they considered the real value decline, which seems substantial less when one looks at the Fraunhofer charts.
There will be a bottom to the value decline as PtG will come in when day-ahead price becomes ~<€25/MWh.
As PtG(H²) can then produce cheaper H² then 'steam reform' the present method. Check at e.g. IEA.
Considering the costs decreases of offshore wind towards €15/MWh, much of offshore produced electricity may end up being gas.
Well, the average bid price in the statistic you mentioned is €61.6/MWh, which is about $70/MWh. Also, like most technical things, Germany can install wind turbines cheaper than the rest of the world (about $1800/kW). If I put that into my calculation, the plant returns its investment in about 13 years. The wind and solar business operates on low margins, so this is quite reasonable.
Let’s not start the whole “nuclear is just as intermittent as wind” debate again. We both have made our positions clear on that.
About the integration costs, this is fairly assigned to wind simply because of the spatial mismatch between wind supply and power demand. In Germany, wind power is largely generated in the North, while a lot of demand is in the South. A lot of expensive grid extension is required to avoid grid congestion (and the associated curtailment and redispatch costs) in the North during times of strong winds. As the German experience shows, these grid expansions are plagued by Nuclear-like delays and cost escalations due to public resistance. Conventional generators can simply be built close to demand centres to avoid this issue.
While integration costs are caused by the spatial mismatch between wind supply and power demand, value declines are caused by the temporal supply/demand mismatch created by the inherently variable nature of wind power. As discussed in the comments of the previous article (linked at the top of this article), the small mismatch between wind value observations in 2017 and the model projections used in this analysis can be fully explained by the fact that Germany uses the grids of its neighbours with much lower wind shares to balance some of its fluctuating wind output. The model runs assumed a uniform wind deployment across Europe, implying that Germany’s neighbours would be generating similar amounts of wind power at the same time as Germany, limiting Germany’s ability to use wind exports to mitigate the value decline.
Please link the IEA report stating that PtG plants operating at the low capacity factors required to balance wind while storing the intermittently produce H2 can outperform SMR at €25/MWh electricity prices. I’d like to check it out.
The IEA report you requested:
https://www.iea.org/newsroom/news/2017/april/producing-industrial-hydrogen-from-renewable-energy.html
I stated bid prices of €40-€63/MWh, which deliver an av. price of €51,50/MWh, so I don’t understand your average.
Since ~ spring 2018, German authorities started to correct the spatial mismatch by assigning correction factors on the bid price for wind farms in the windy north. So more wind farms in the south will win.
It’s one of the factors which created the increase in wind prices during 2018. Far less competition as getting all licenses takes easily more than a year. Worse competing bidders knew it because the license process is public.
The new rule came because winners often couldn’t realize the wind farm as in the end they didn’t get all necessary licenses.
Btw.
I responded more than a month ago to your request , but somehow it was never published.
Thanks for the report, I’ll have a look at it next weekend.
The average I quoted is a weighted average, which is the more representative one: https://www.windpowermonthly.com/article/1496669/german-wind-auction-undersubscribed-again. There is sometimes one or two very low bids that make for nice headlines, but the reality is that most bids are towards the upper end so that people can actually make a little bit of money on the investment.
1. The first point is that it is ridiculous to use an historical average 30% CF when wind turbine technology is changing so fast many new wind farms even on shore are exceeding 45%, maybe lower in Germany but as you say cost per MW is also lower.
2. In Europe a WACC of 8% is too high 5.5-6% would be about right.
3. Like all plants they will reduce efficiency as they age but just as IC engines improved longevity as the technology improved the same is happening with wind turbines. The turbines you quote showing declining performance after 9 years were often designed with more or less standard design bearings and gearboxes. Now that there is a much better understanding of the load cycles in wind turbines and volumes have increased, bearing and gearbox companies in particular but also blade companies have designed for much longer life and much more cost effective replacements, if required. In some cases just like in FF and nuclear plants, reblading and repowering of older turbines is actually increasing AEP above the original base spec.
Feeding all those variables in redoing your DCF more than halves your breakeven cost of power even if CF is only 40% and WACC is 6%.
As for very low price periods undermining economics, that is fairly easily countered by grid controlled hot water heating and smart EV charging until at least 65% VRE market share.
In summary the study is about as useful as all those studies that “proved” that humans could not stand speeds above 20 miles per hour
1. I have heard a lot about this sharp increase in wind power capacity factor, but, as outlined in the article, the real-world data (BP stats review) suggests that the global average capacity factor has been stagnant for the past 5 years. Even though this data reports the entire wind fleet, the installed capacity has doubled over the past five years, so superior performance from these new turbines should have definitely made a sizable impact on the global average capacity factor. Why do you think this has not happened?
2. I still think the fair discount rate for energy technologies in developed nations is around 8% (much higher in developing nations). It is lower in some countries primarily because policy frameworks protect wind farms against their value declines and integration costs. In a free market, the risk premium for wind power investment would be much higher. Artificially low financing costs as a result of government incentives is a form of subsidy.
3. I’m always looking for better and more reliable sources. If you have a better source for how wind farm performance declines or O&M increases over time, feel free to share.
Smart EV charging to balance wind will be highly inconvenient because of the randomness and long timescales of wind variability. Water heating demand is simply too small to have a meaningful impact and also becomes impractical due to the long timescales of wind variability. Do you have a source for your “fairly easy” 65% number? I would be interested to have a look at that.
1. Below are 4 articles re windfarm capacity factors, there are many others all showing a clear but not perfect trend to higher capacity factors with newer technology.
https://reneweconomy.com.au/new-australian-wind-farms-
reach-nearly-50-capacity-factor-99179/
https://www.greentechmedia.com/articles/read/wind-power-could-blow-past-hydros-capacity-factor-by-2020#gs.jZX8edM
https://www.energy.gov/eere/wind/downloads/2017-wind-technologies-market-report
http://energynumbers.info/capacity-factors-at-danish-offshore-wind-farms
2. While integration costs may be higher, they can also be lower. a) For example in the US, high wind states have reduced spinning reserves because you don’t need to cover for the loss of 500-1,000 MW in one hit as you do for large thermal generators and statewide wind and solar output can be forecast day ahead at least as accurately as demand
b) high capacity factor wind turbines have lower rated wind speeds so the output is steadier as fluctuations in wind speed above the rated speed don’t affect output and rise and fall more graceful so reducing short term balancing costs
c) high CF wind turbines can be profitable in many more sites so windfarms can be located closer to loads so transmission infrastructure and losses per MW are actually falling.
3. Both Eon and 50Hz have stated publicly that they can get to 60-70% renewables in Germany without additional storage. The US, France, China, India, Canada, Italy and even Australia have a) higher hydro capacity as a share of peak load ranging from 16-60%, b) lower energy consumption per square km c) better wind and solar resources per square km than Germany so if Germany can get to 60-70% renewables these other countries can as well.
4. discount rate estimates are very subjective but wind and solar have zero short run marginal costs. Thus if the owner can’t service the debt, the lender can seize the property and resell it to someone who can make a marginal contribution. If a coal or gas plant goes bust because of fuel costs or maintenance issue, it is far more likely that the lender will not only have an unsaleable asset but a very large decommissioning bill. Therefore the FF plant has a much higher risk premium. In addition the FF plant has fuel price risk, regulatory risk, (changing pollution requirements, carbon taxes etc.) even water availability, so whatever WACC you think is appropriate for a coal or gas plant, it will be a quarter to one third lower for wind and for solar also until solar regularly produces some 80% of peak demand, .
5. the average EV is parked for 140-150 hours per week. It needs about 6-8 hours per week charging from a 6 kW wall charger so it needs to access charging for less than 6% of the time that it is parked, pretty easy to manage I would have thought.
Water heating in SA is about 200 MW for 4 hours a night of an average daily load of 1,400 MW. that represents a substantial swing opportunity
Re. 2. Spinning reserve essentially is fast response back-up. Reserve falls into categories which include dispatchable plant that takes hours to be ready to synchronise. On the one hand fast response reserve needed to cover wind should as you say be less than for a 500-1000 MW thermal generator, but dispatchable reserve needed to cover wind intermittancy is far greater. E.g. ten 1GW thermal sets might need 1GW of spinning reserve, whereas 10GW of wind power will need 10GW of dispatchable backup capacity. Very evident in Germany where the conventional fleet capacity more than matches that of the renewables fleet.
High capacity factor wind turbines are really a fiddle. They are designed to operate at lower wind speeds, so achieve higher capacity factors, but the design is a compromise because output at higher wind speeds has to be curtailed. They have been around for some time. Overall they produce less energy and haven’t been popular with developers keen to maximise energy production.
Re. 4. Wind and solar’s zero short term marginal costs comes with the problem that market prices decline as more capacity is built. The point has now been reached in parts of Europe where wholesale prices have been driven below that required to make new capacity economic unless supported. Unfortunately at a time when market support is being withdrawn. Unless subsidies are reintroduced development will likely tail off threatening 60-70% renewables targets.
Re. 5. In theory smart charging of EV’s sounds fine. In the UK though there are significant problems with networks not being designed to allow concurrent charging of many EVs due to capacity problems. Germany I understand historically has over engineered networks so would cope better.
Re. 2. Reserve for thermal is more complicated and far more expensive as shown by the 7 Belgian nuclear reactors. They supply normally ~50% of demand.
In 2018 during 1 month 6 of 7 were off, during 4 months only 2 of 7 operated. Not a real exception as similar occurred in 2015.
They arranged alternatives and even rolling black-out schemes in case all nuclear went down. Which could and can occur easily though not frequently.*)
As those 7 reactors are in two clusters at opposite sides of the country they need 2 x 1GW expensive spinning reserve and 4GW cold reserve**) for their 6GW nuclear capacity. That is a more expensive reserve situation than the reserve needed with wind + solar…
So it seems to me that the complaint about extra costs due to the intermittency of wind + solar are not valid. Unless same is applied to nuclear.
_________
*) Not impossible. E.g. when an heavy strike by a drone causes a reactor to follow the Fukushima escalation path, the regulator has little choice than to close all reactors like the Japanese after the tsunami.
**) Part of that cold reserve can also be import as with wind+solar.
Belgium has a fleet of old reactors that should have been replaced with a programme of new ones years ago. New reactors would now be achieving > 90% availability.
Bas, a very unconvincing argument.
So we agree that the US fleet (the largest in the world) and the Belgian fleet should be replaced as they both are ~39yrs old on av.*)
As I explained, even with 90% availability there is substantial chance that near the whole fleet is out. It occurred not only in Japan.
Also in France few years ago, when weak steel parts**) used in nuclear reactors caused a near accident and major part of their fleet was out for replacements. The Germans even had to reopen a coal plant in the south to help the French out….
It demonstrates that nuclear needs back-up by fossil plants, with similar capacity as wind & solar…
______
*) So claims that nuclear can last 60yrs are also nonsense.
**) Due to fraud with the nuclear certification papers.
With an ageing fleet there is a risk of low availability. Low availability with conventional plant is manageable too as outages can be planned to occur when system demand is low so replacement gen. capacity is not needed.
With a well managed fleet comprising newer reactors the risk statistically is too low to require the level of back-up anywhere near that which renewables requires. Hence renewables should shoulder much of the fixed costs of having conventional plant standing idle for much of the time. Only antis try to argue otherwise.
PWRs can go for 60 years after refurbishment. France’s reactor fleet dating from the 1970s can be refurbished, or replaced with new plants. That’s an economic decision.
Japan has some badly located reactors from 1960s with civil design flaws that should have closed long ago. Europe has extensively reviewed safety since FK to ensure similar accidents could not happen.
We won’t agree about the costs to backup a nuclear fleet compared to a 100% renewable situation.
So I guess you wouldn’t agree with the UK’s National Grid TSO and their stated position?
When forecasting generation availability to meet demand for nuclear they use an effective firm capacity (EFC) of 80%, whereas for wind its 16%. Consequently wind requires about 5 times the level of back-up compared to Nukes. In the UK most capacity dates from the 1970s too. Your Belgian plants are not representative of well managed stations. But then cherry picking data fools few people.
“… wind requires about 5 times the level of back-up compared to Nukes.”
Sorry, wrong reasoning.
The quote may well be correct but your conclusion is wrong.
a) In Switzerland, France, Japan, China and Belgium, the 80% availability figure has now been proved to be too high.
b) outages at nuclear plants are much longer duration than low wind periods
c) the minimum wind availability is increasing with better turbine design for example Vestas says their latest 2MW designs produce 40% more full load hours than 10 year old designs
d) the cost of overbuilding and maintaining wind capacity is about 1/4 the cost of overbuilding nuclear capacity
e) in contrast to nuclear proponents no-one ever suggests a super dominance of wind power, solar is largely complimentary to wind and hydro and biomass can work much better to fill the gaps than nuclear can
Peter,
a) In 2017 the global average capacity factor for nuclear was 81.1%. See Pg. 8 below:
https://www.world-nuclear.org/getmedia/b392d1cd-f7d2-4d54-9355-9a65f71a3419/performance-report.pdf.aspx
Nuclear stations around the world are ageing and not being replaced affecting availability in some mature markets. But modern reactors achieve >90% availability for decades. They have too otherwise the economics would not work.
b) During cold wintry spells in the UK wind power can be becalmed for a few weeks which is more than a PWR outage for refuelling.
Wind power is not dispatchable. Whereas nuclear planned outages for maintenance can be scheduled for off-peak periods when system demand is low and the capacity is not needed. In the UK that is the summer months. Unlike wind which has a habit of not generating for days during periods of peak demand in Northern Europe.
I would agree that the economics of non-firm renewable power is good compared to nuclear. Particularly so in places like Aus. where solar c.f. is about 20%, twice that of N. Europe. However, nuclear is a lower cost option than renewables plus expensive hydro storage.
@Nigel
“modern reactors achieve >90% av. for decades”
That’s your hope, not supported by history.
People must learn how to operate those complex machines.
E.g.
USA history shows that it took decades before NPP’s reached >90%.
“High capacity factor wind turbines are really a fiddle … output at higher wind speeds has to be curtailed.”
Not really. They do produce more electricity!
They reach higher CF’s because they;
1- are higher = more and more stable wind.
2- combine longer blades with more advanced blade regulation so they start with lower wind speed and can afford to run in similar high wind speeds as older models (~25m/sec);
3- they have stronger and more flexible blades hence those bow with a sudden burst.
Due to point 1 it are mostly also more powerful wind turbines. Consider the 12MW Haliade-X wind turbine which will be installed in NL this year, and is projected for our ‘Hollandse Kust’ offshore wind farm.
It is predicted to have a CF of 63%…
https://www.offshorewind.biz/2018/05/10/ge-goes-into-haliade-x-12-mw-details-infographics/